Profiling Data
Overview
One of Magpie's most useful features is data profiling. It provides a means to quickly review the contents of data and understand the dynamics of each column in a table or query result.
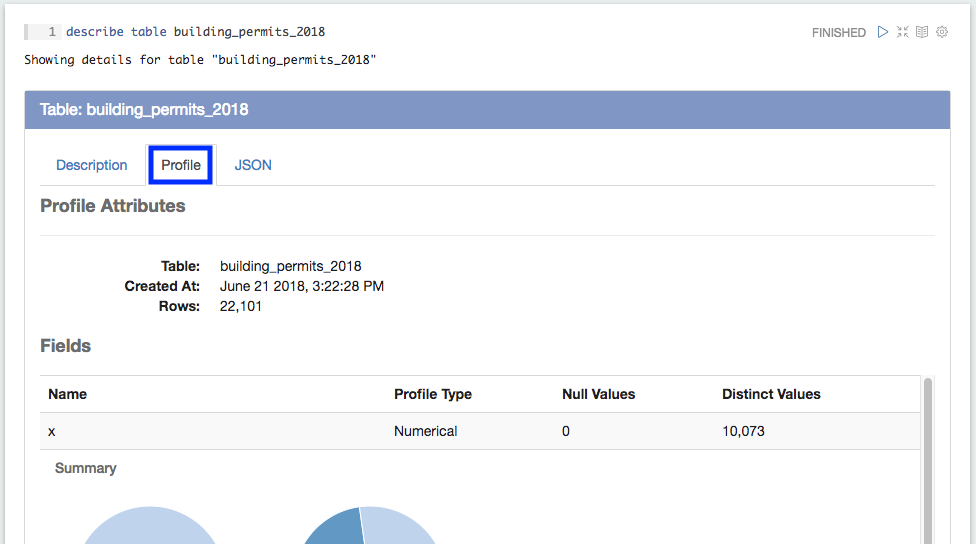
The profile command can be run against a table or against the results of a SQL statement. Once a profile is generated for a table, it is persistent and is available in the Profile tab whenever the DESCRIBE command is run for that table.
Profile Contents
The goal of generating a profile is to characterize all of the data in a simplified way that users can understand quickly. The profile generates a few key pieces of information at the table level and at the individual field level. This information includes:
- At the table level, a total row count is generated.
- A more detailed set of profile information is produced for each field:
- Count of Distinct Values – The number of distinct values present in the column.
- Count of Non-null Values – The number of non-null values in the column.
- Profile Type – A higher-level classification for the field that goes beyond the base type (e.g., integer, string, etc.) and focuses on describing how the field is used (identifier, categorical, numerical, etc.).
- Top Values – Displays the top 10 values in the column along with their frequency and the percent of the total that they represent.
- Calendar/Time View – For date and timestamp values, a calendar-based view of the data is shown allowing you to quickly see how values are distributed across years, dates, month of the year, day of week, day of month, and time of day.
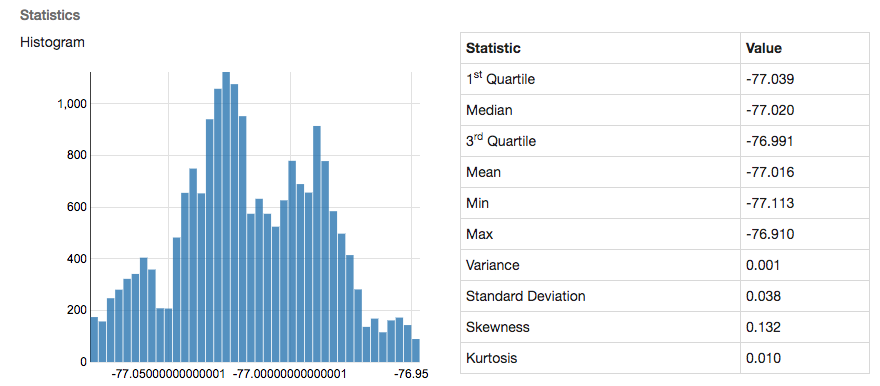
- Histogram – For numerical values, a histogram showing the distribution of data is automatically generated.
- Descriptive Statistics – For numerical values, a set of descriptive statistics including a breakdown by quartile, mean, median, and variance.
Each of these profile attributes is displayed at the field level within the profile results view in the Magpie Notebook including charts for many of the key metrics. A history of all previous profiles is also retained. The Magpie user interface does not currently display historical profile information, but it will be made available in a future release.
Generating a Profile
You can generate a profile on a table using the following syntax:
profile table target_table_name
You can generate a profile on a SQL result using the following syntax:
profile sql (select column_1, column_2 from target_table_name where created_at >= '2018-01-01')
Viewing Profile Information
When a profile is initially generated, it will be put into the result area for the paragraph in which it was executed. A screen shot of the profile in place is shown.
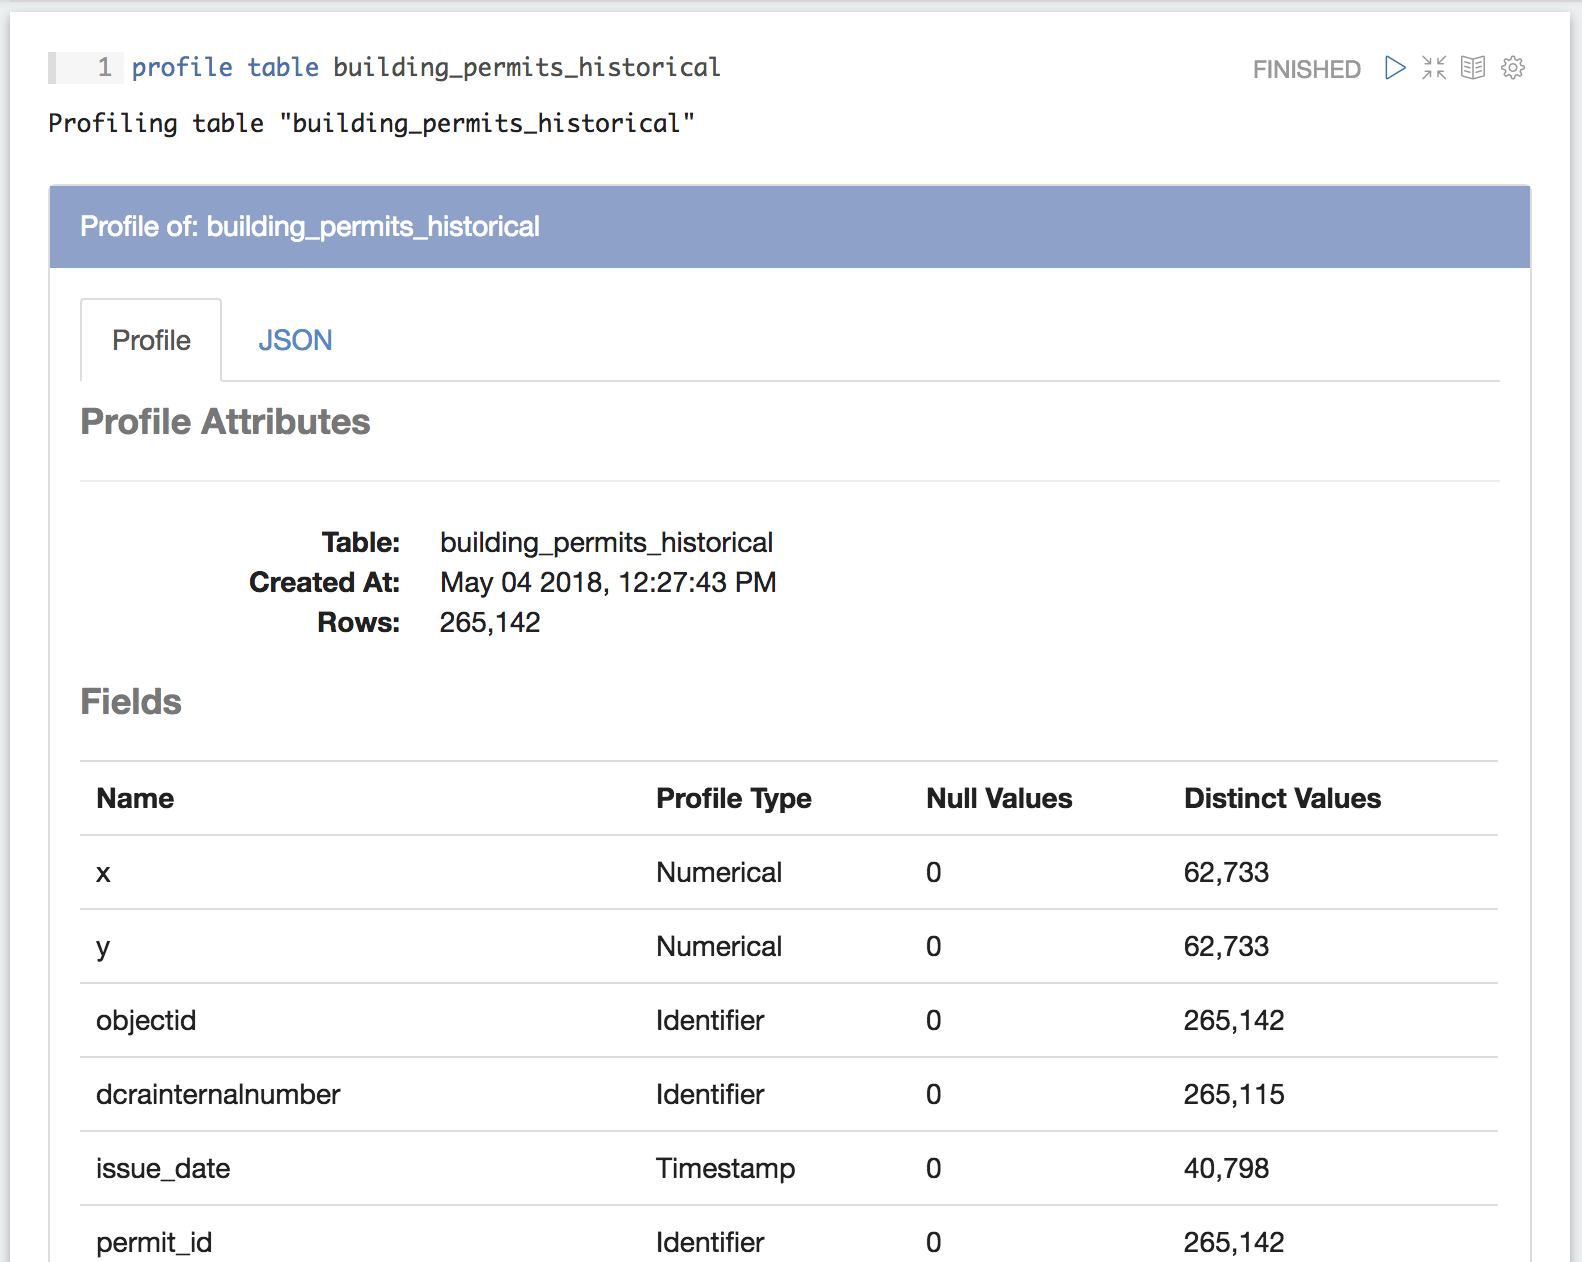
The description of each field can be expanded to show different visualization based on the profile type by clicking in the row for each field. A few examples of profile data are shown below.
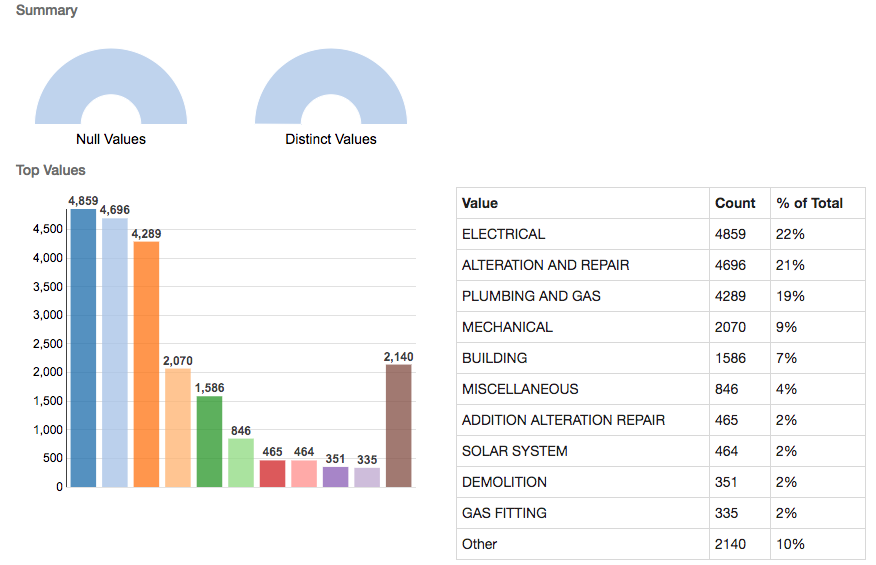
The screenshot below shows the basic view that common to all fields displaying the distribution of the top 10 values in the field.
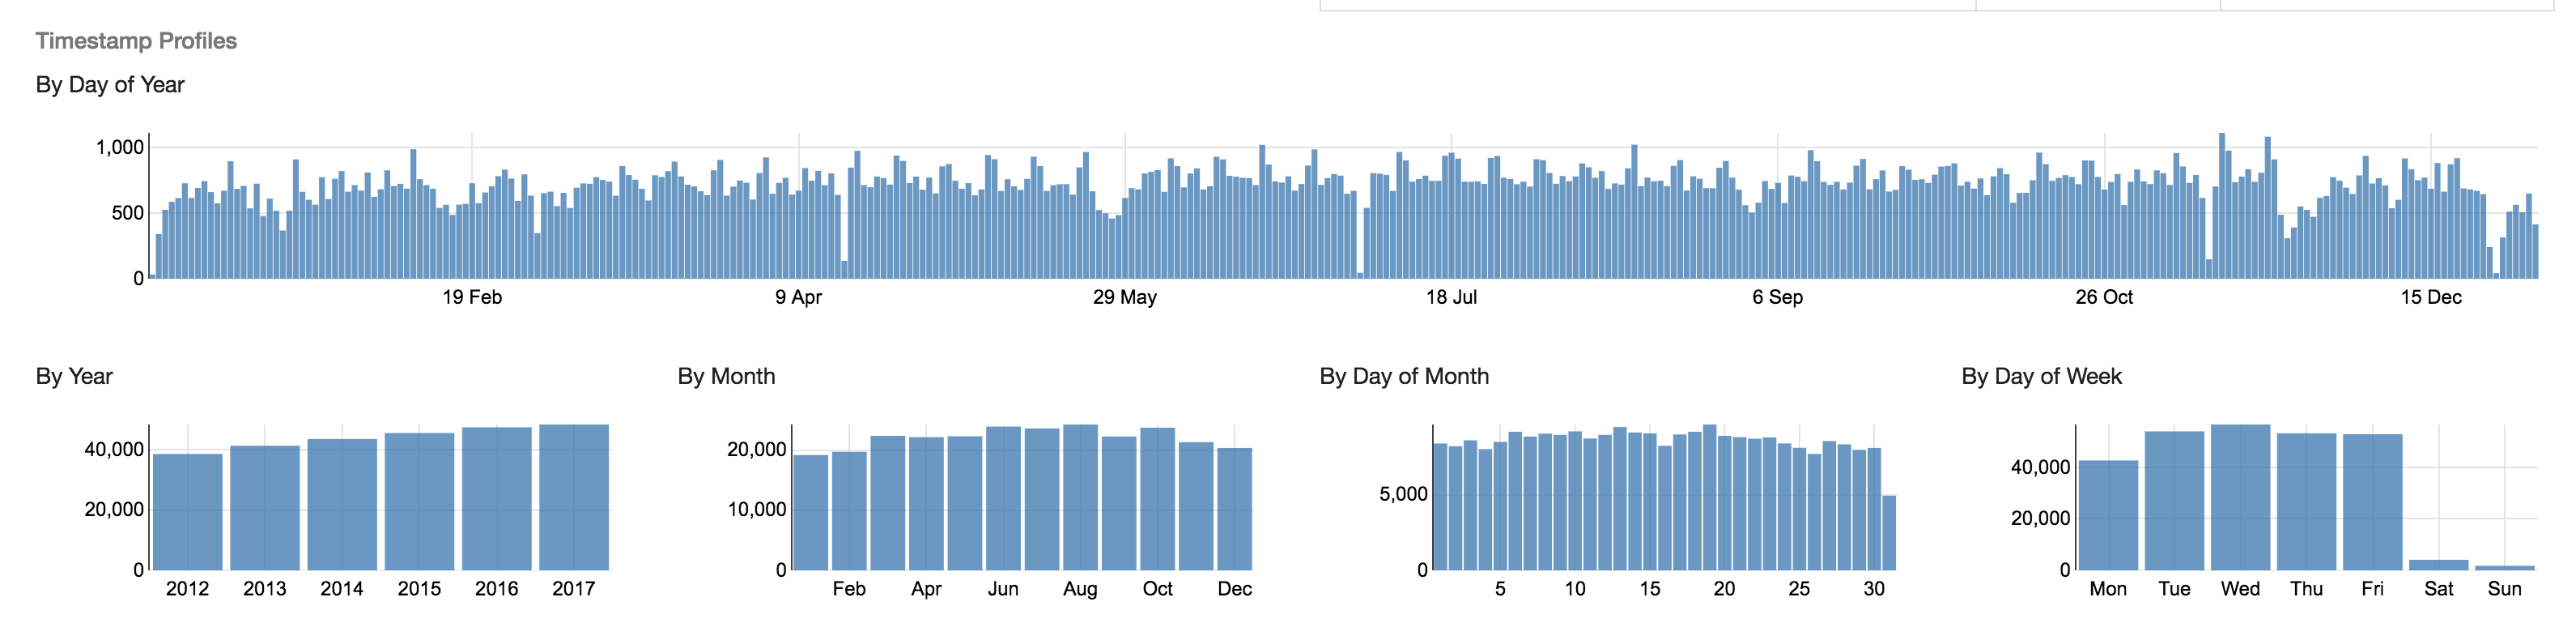
This screenshot the calendar view that is available for date fields. It allows users to quickly assess the distribution of records across time and identify potential issues.
This screenshot shows the histogram and descriptive statistics that are generated for numerical values.
Retrieving Existing Profiles
Profile information is retained with the other metadata about a table after it is generated. When the describe command is run, the profile will be available in the "Profile" tab of the describe output.