Exploring Data
Once you have created a notebook, you can begin exploring data. This is typically accomplished by using SQL to query data from tables and display the results within a notebook paragraph. Scala and Python can also be used to query data, but using SQL, either through Magpie's scripting language, or directly in a SQL interpreter block provides formatted tabular output and the ability to do basic data visualization.
- When using SQL through Magpie there is a bit more flexibility in how data can be used for subsequent operations and there is more control over the number of results returned.
- When using SQL with the SQL interpreter, the syntax is somewhat simpler, however there is a strict limit of 1000 results returned.
Magpie SQL SELECT statement very closely follows the SQL syntax used by Spark SQL.
Setting the Schema
The first step in querying data in Magpie is setting a schema to use. This is accomplished via the USEcommand as shown below.
USE SCHEMA schema_name;
Once the schema is set, it will be persistent across subsequent commands in the same paragraphs and other paragraphs within the notebook.
Listing and Describing Available Table Structures
Once you have selected a schema, you can list the tables available in the schema by using the LIST command. This will show a list of tables in the active schema as shown here.
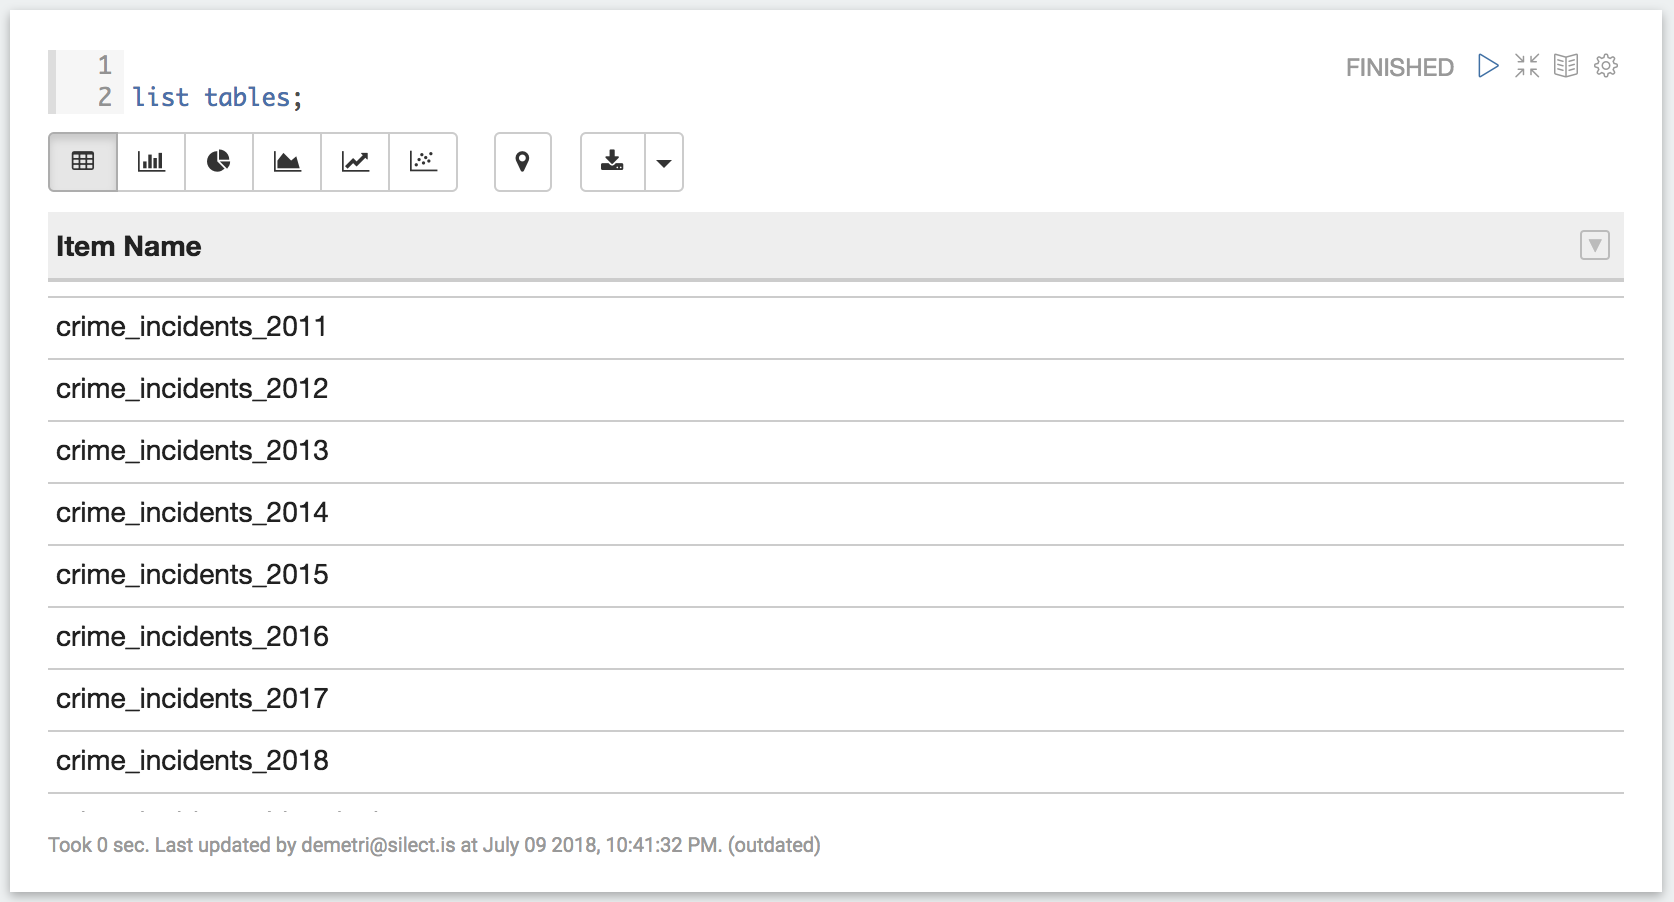
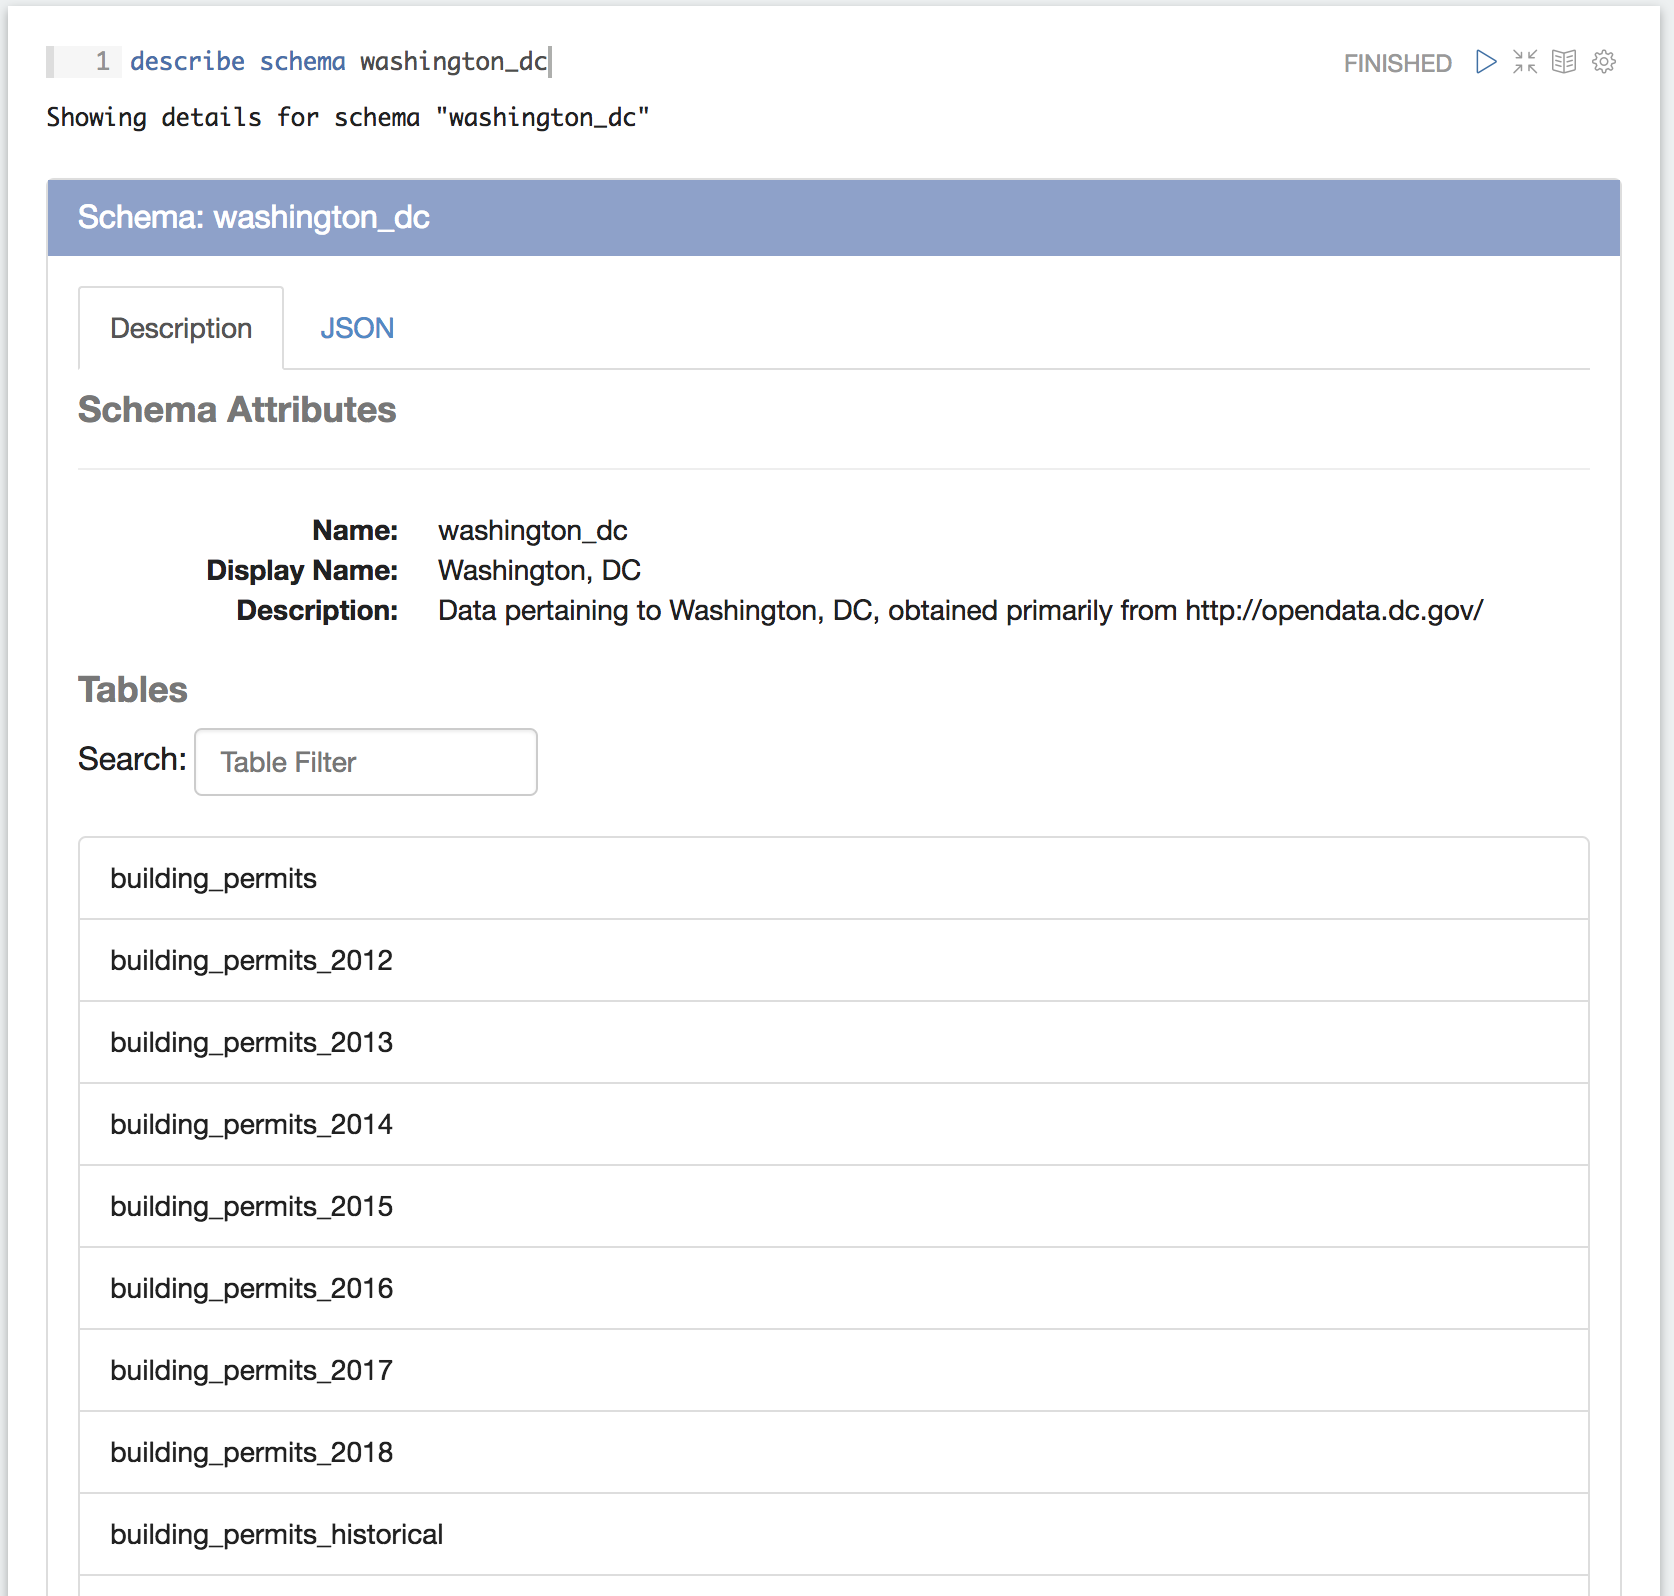
Alternately you can describe a schema using the DESCRIBE command.
You can get more detail about the columns available in the tables using the DESCRIBE command.
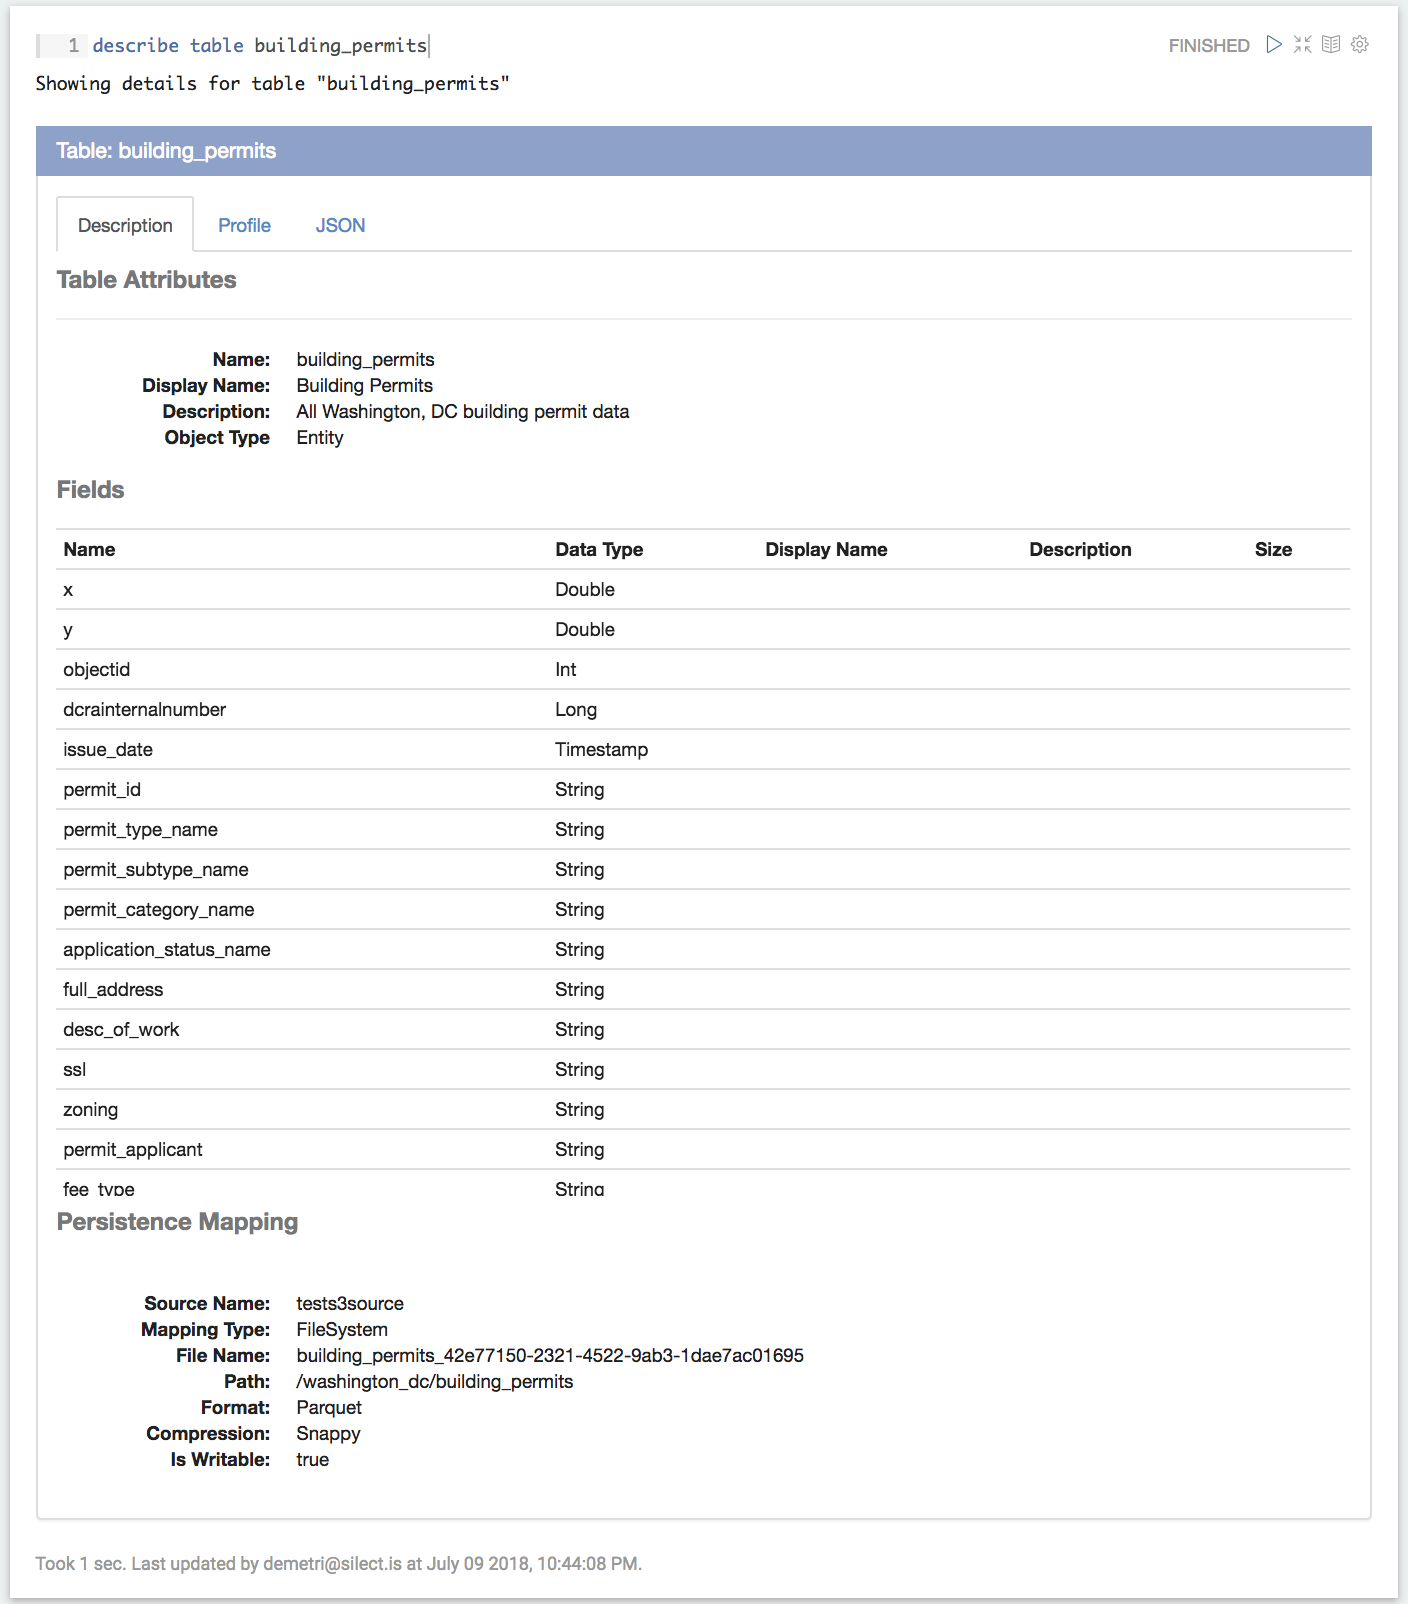
The describe command returns the data types for each column as well as the persistence mapping associated with the table.
Using SQL with the Magpie Interpreter
As noted above, SQL queries can be run either within a Magpie interpreter paragraph or in a SQL interpreter paragraph. When using the Magpie interpreter, you need to explicitly tell it that you are using SQL and that the results should be shown immediately.
Note: Magpie, like the underlying Spark platform, defers the execution of a data transformation or query until the results need to be used in a downstream process, for display, or to be saved to a file. This means that when using the Magpie DSL, execution often needs to be triggered by a show statement.
The screenshot below shows the typical syntax for querying data using the Magpie interpreter.
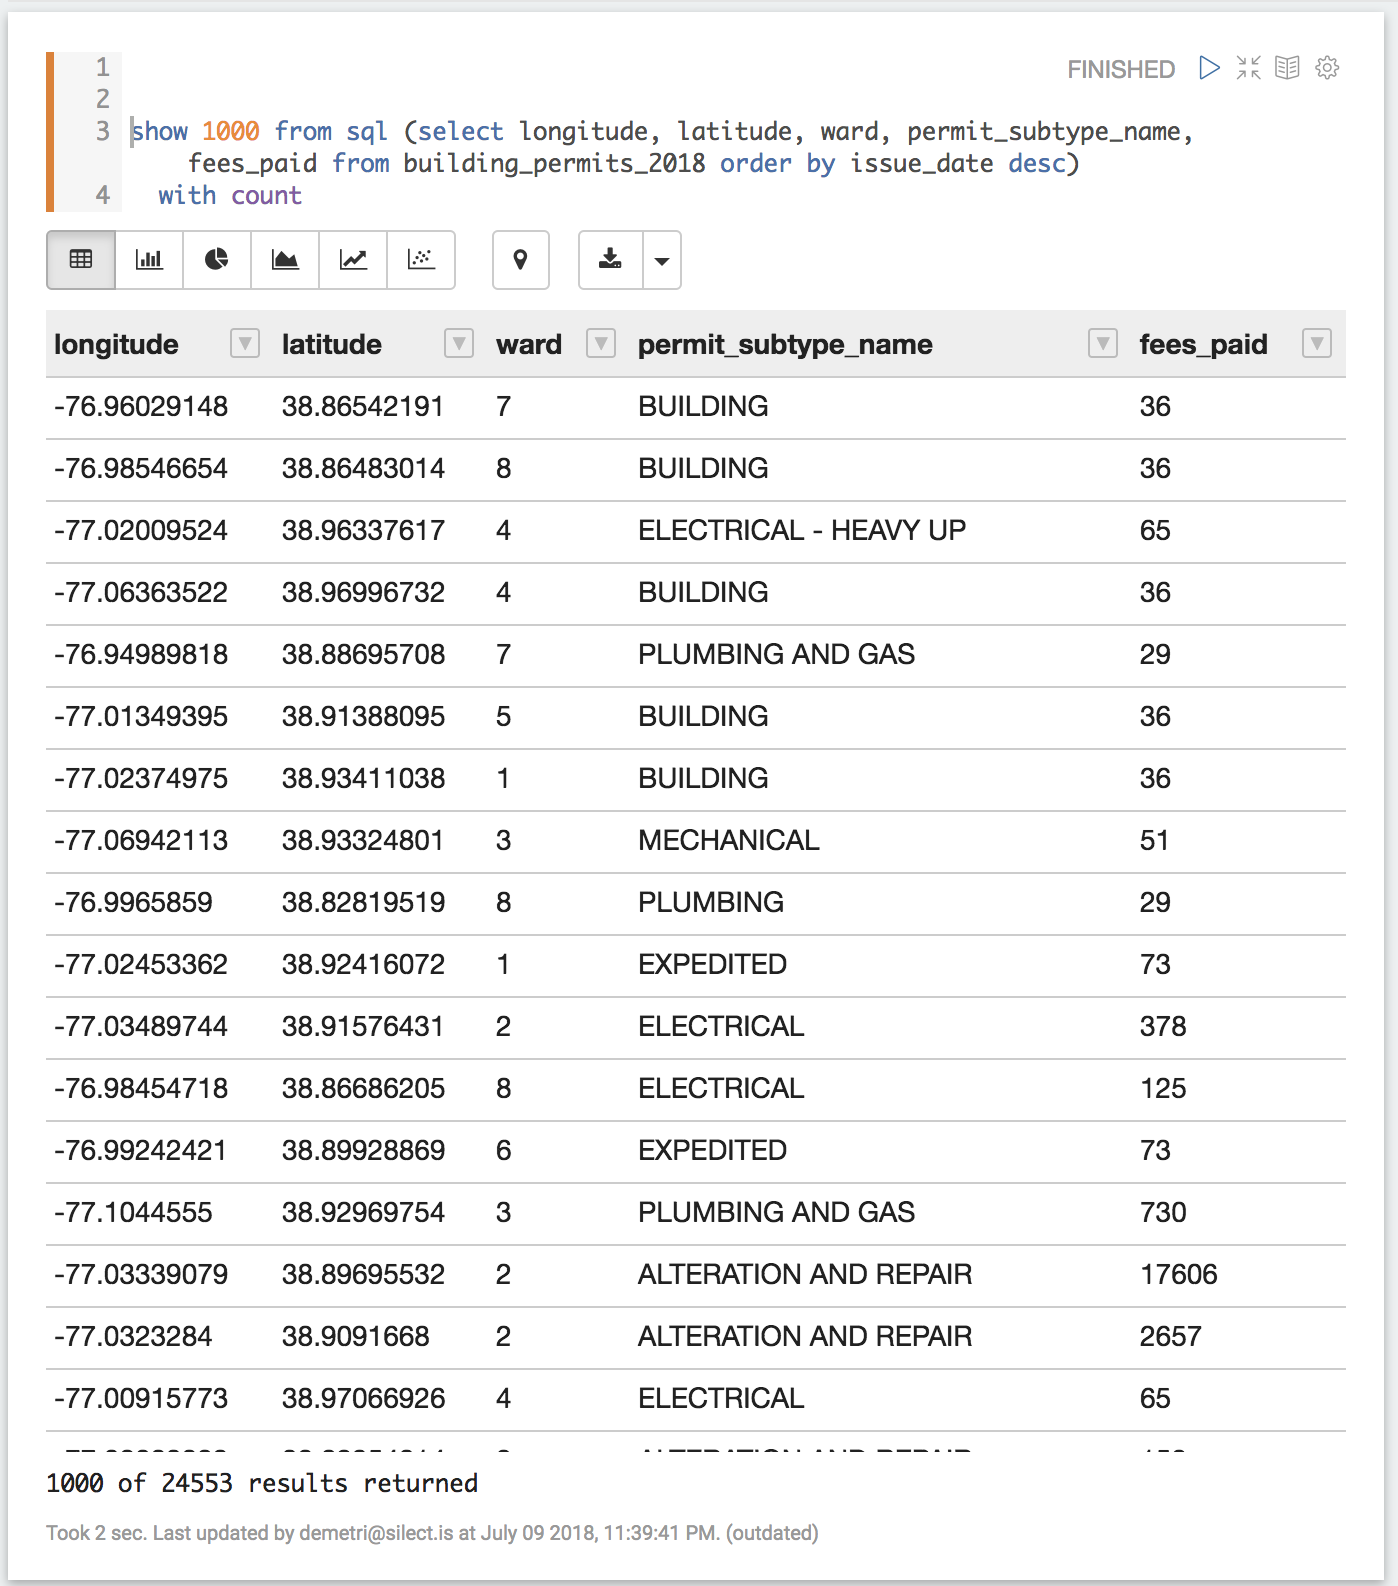
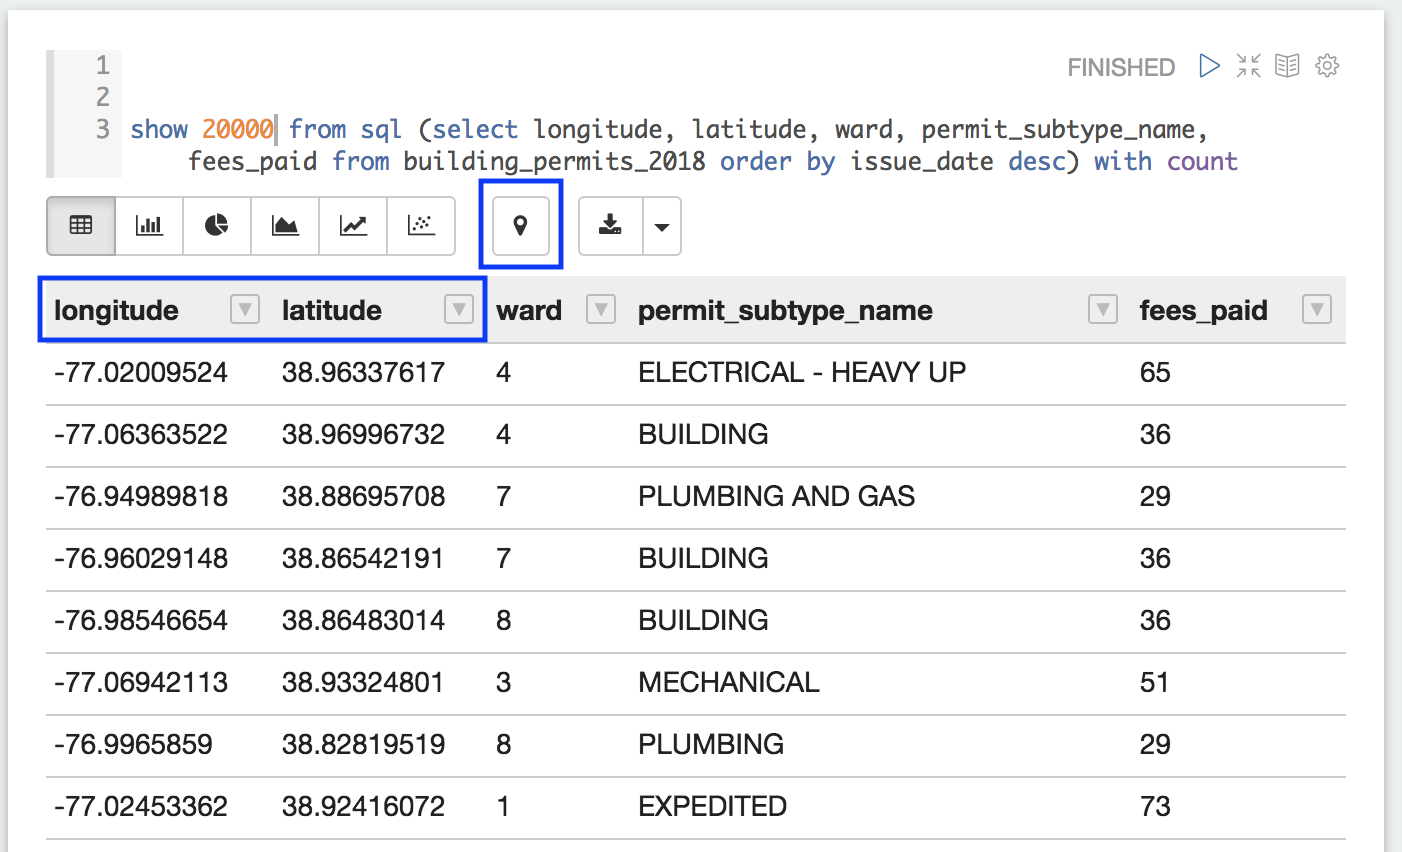
Note the SHOW syntax at the beginning of the statement. This forces the interpreter to actually retrieve and display the data. The WITH COUNT clause at the end of the statement causes the total number of rows in the result to be displayed even if only the first 1000 rows are being shown.
The results of the last Magpie command executed are held in a special temporary table called name result. The result table can then be referenced in subsequent commands.
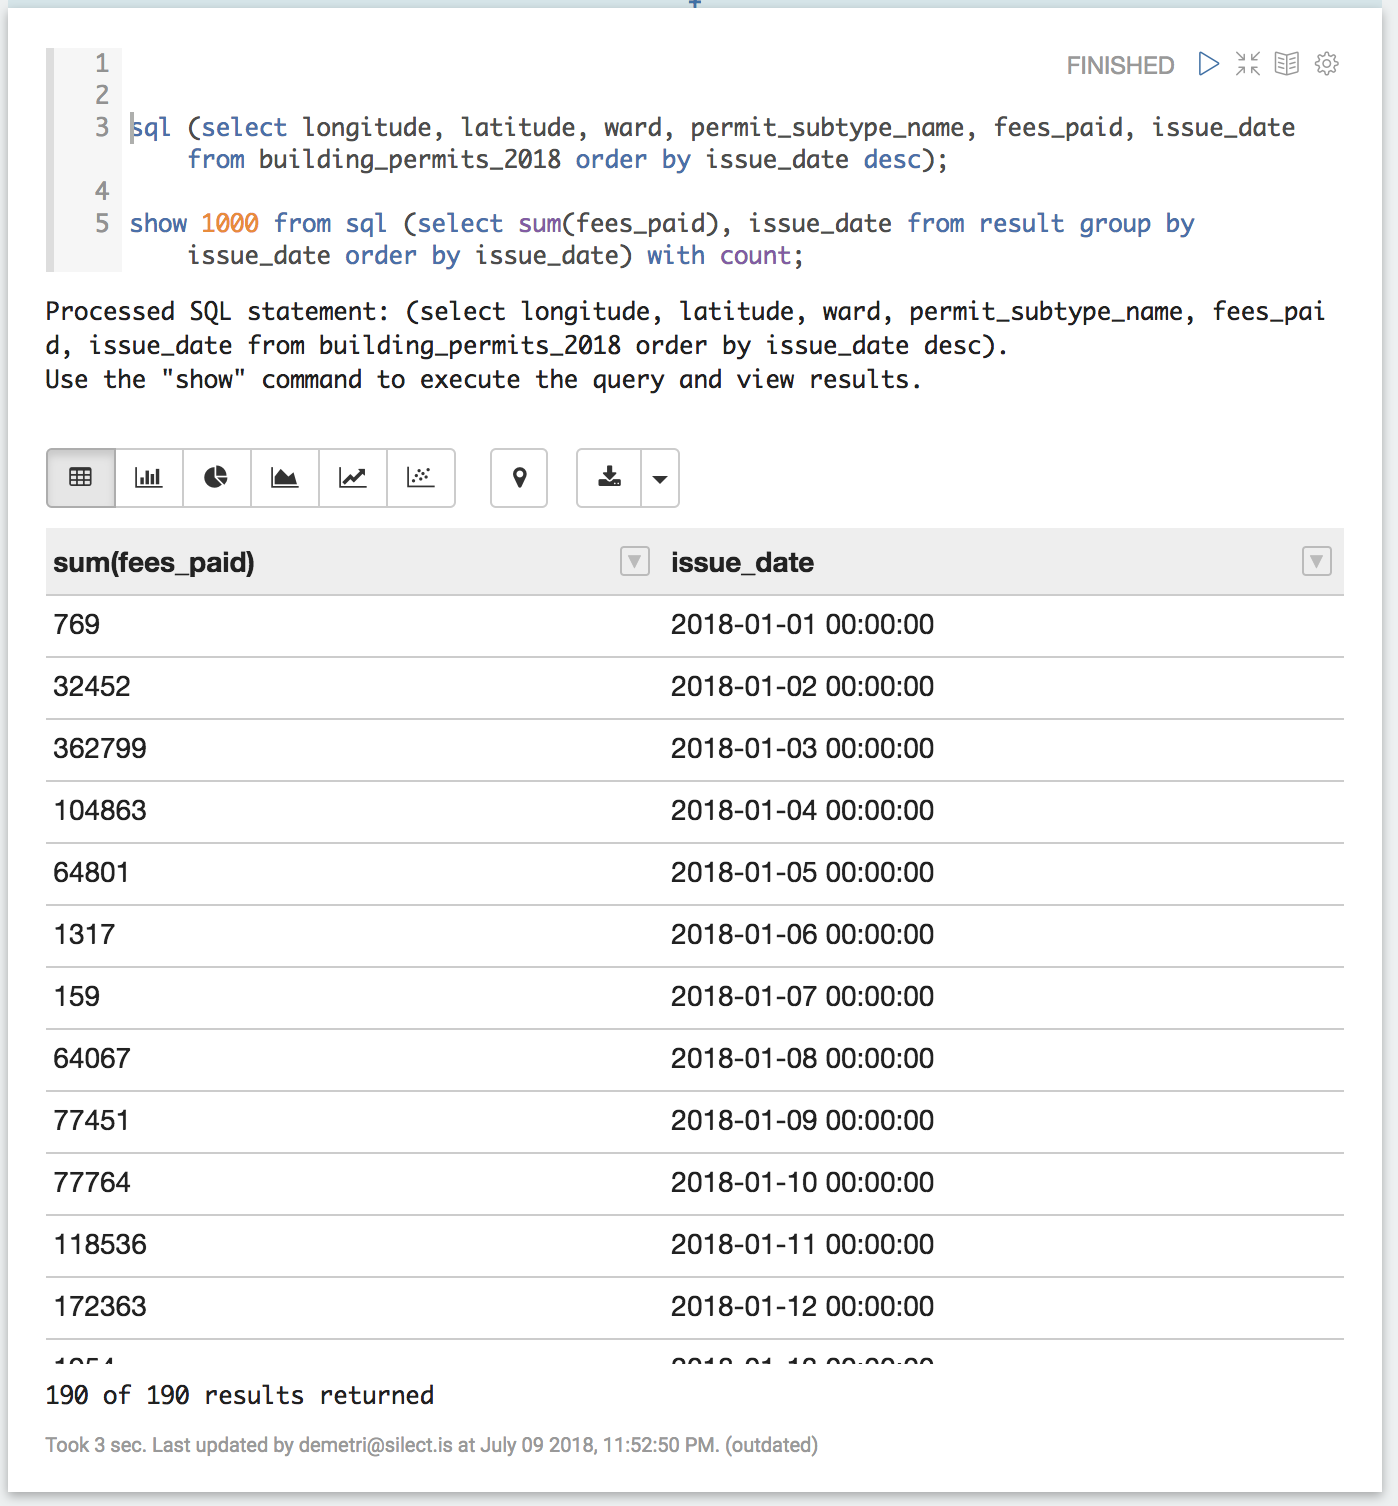
The ability to reuse the results of a query will come into play later, particularly when saving data to new tables and when you begin to build more complex data processing flows.
Using SQL with the SQL Interpreter
When using the SQL interpreter, you can simply type in a selectstatement as shown here.
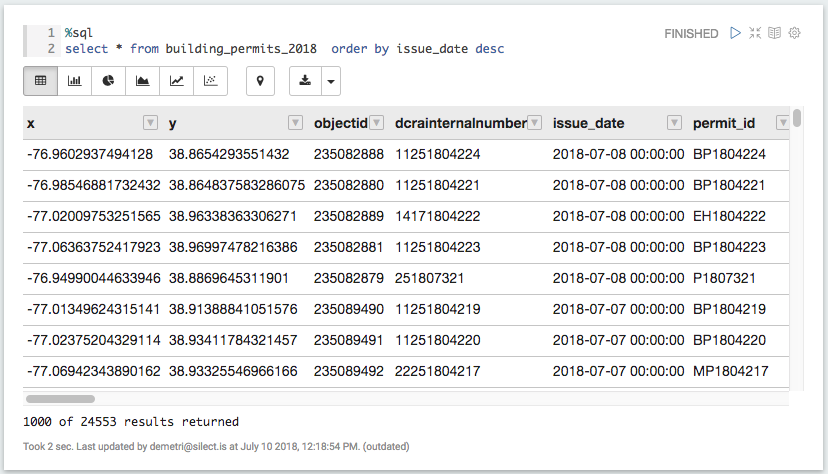
As mentioned above, the number of rows returned is limited to 1000. This means that specifying a sort order is often useful to avoid returning a unpredictable, unsorted set of results.
Using the Tabular Data Display
By default, the results are placed in a table display in the results area of the paragraph. By default, the columns are unformatted. By clicking on the down arrow button in each column, you can choose a data format to use. You can also sort on a column by clicking anywhere else on the header column.
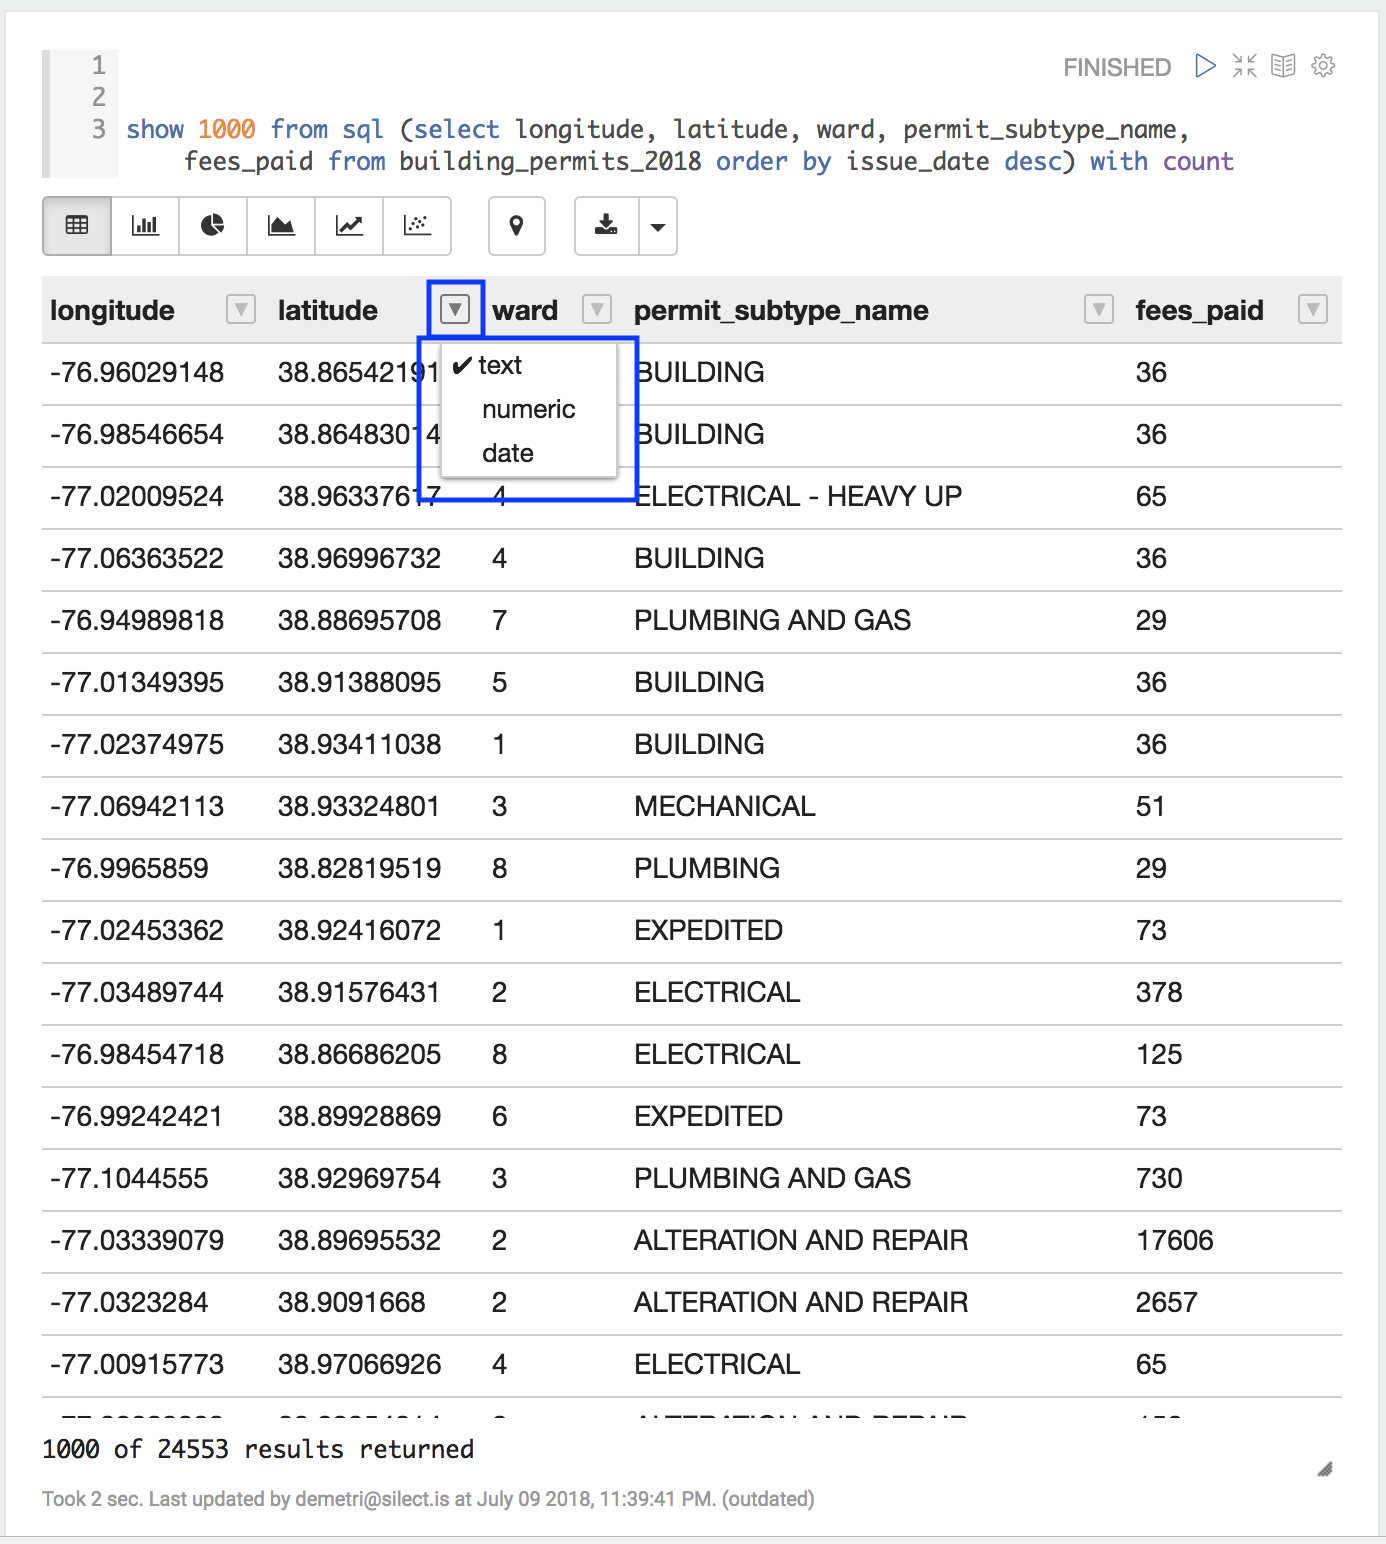
Setting the data type is useful when higher precision numbers need to be displayed, and when there is a need to sort on numerical values. Sorting within the table on a numeric column without specifying the format will cause the numbers to be sorted as text leading to wrong results.
Newline characters within a string value are stripped in this display, so a multi-line value is shown on a single line. This affects only the display — the underlying data is unchanged.
Visualizing Results
Query results can also be displayed as charts. Simply select a chart type using the chart icons at the top of the results area of the paragraph.
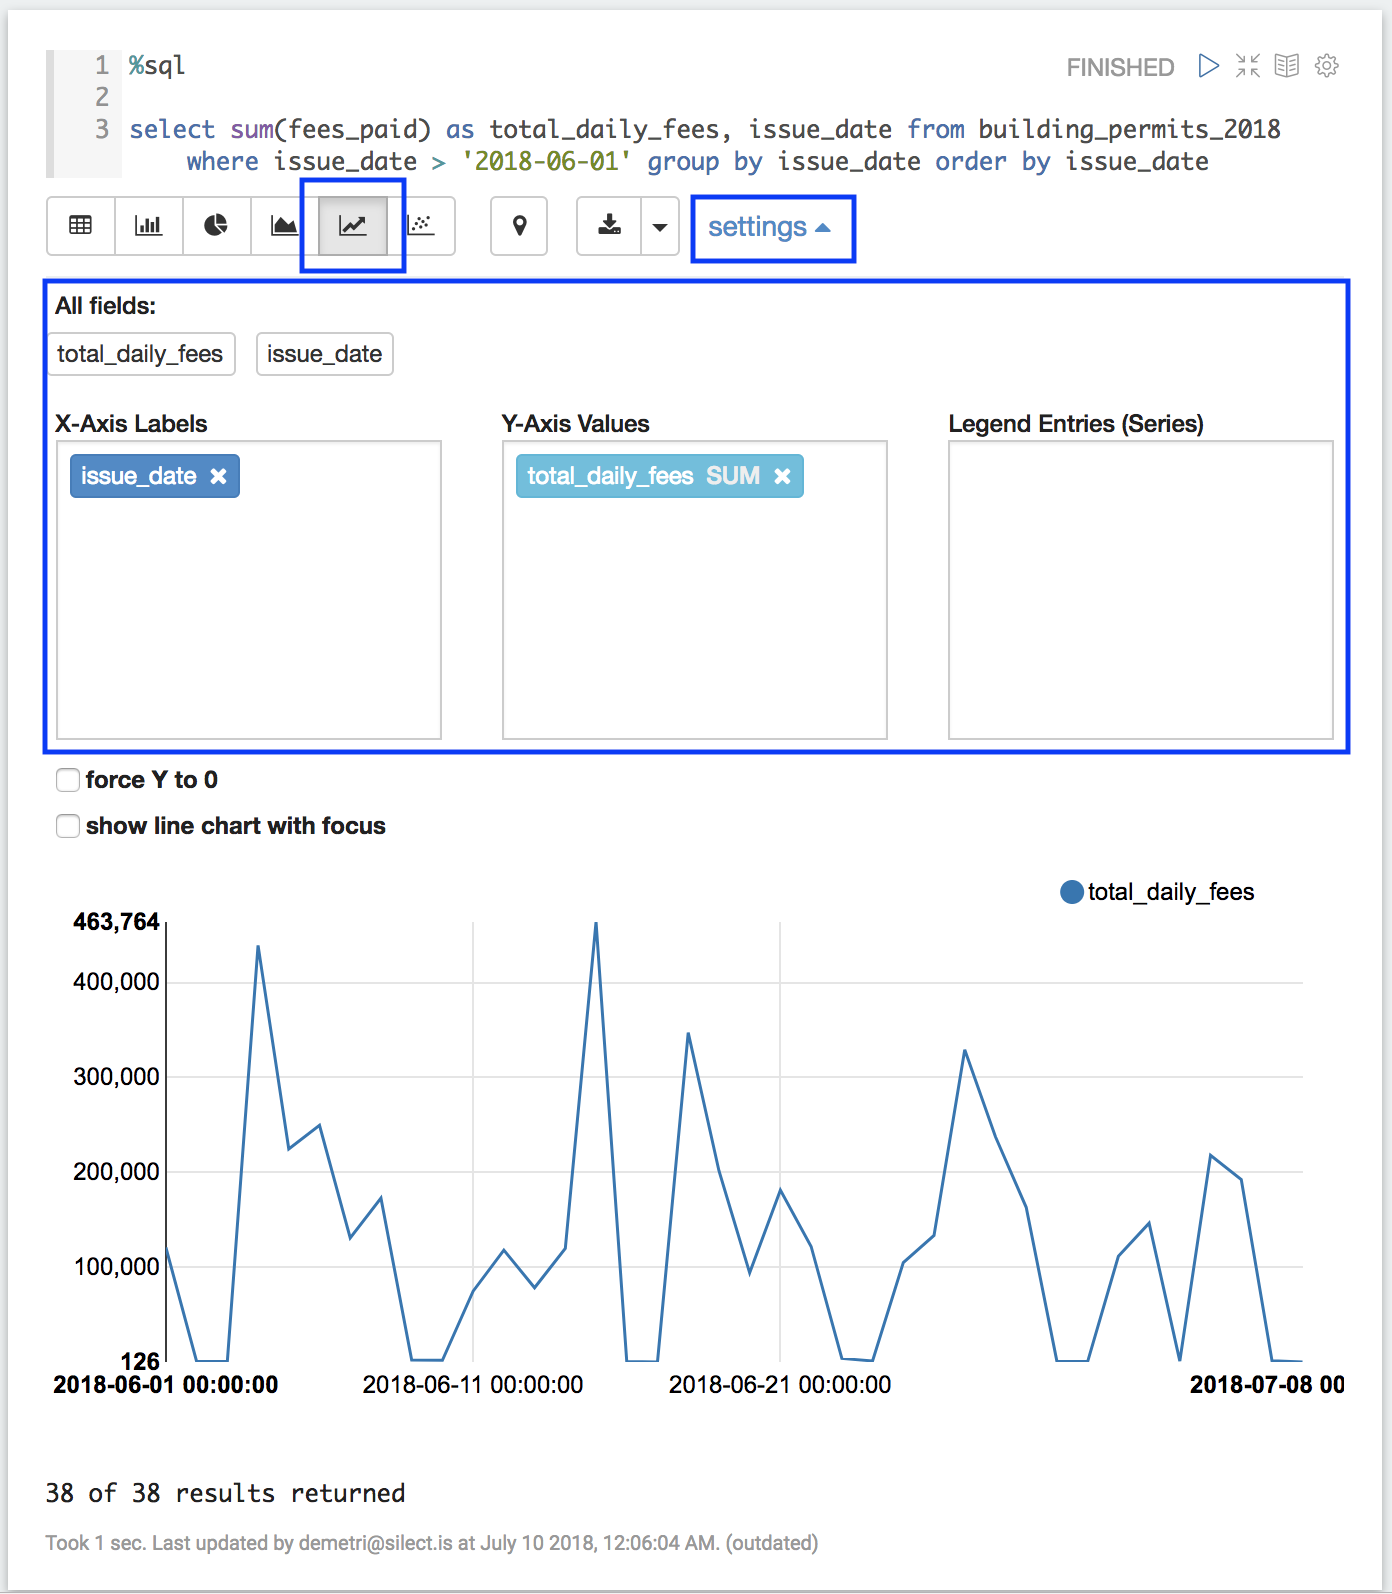
Once you have selected a visualization, the columns to display can be adjusted by clicking on the settings button to expand the options, and dragging and dropping them into one of the boxes above the chart as shown above.
Using Magpie's Geospatial Visualizations
If you have a result set that contains columns labeled latitude and longitude, Magpie will automatically populate a geospatial visualization. This can be accessed by clicking on the map pin icon at the top of the query results display.
This will open a new tab with a map view of the data in it.
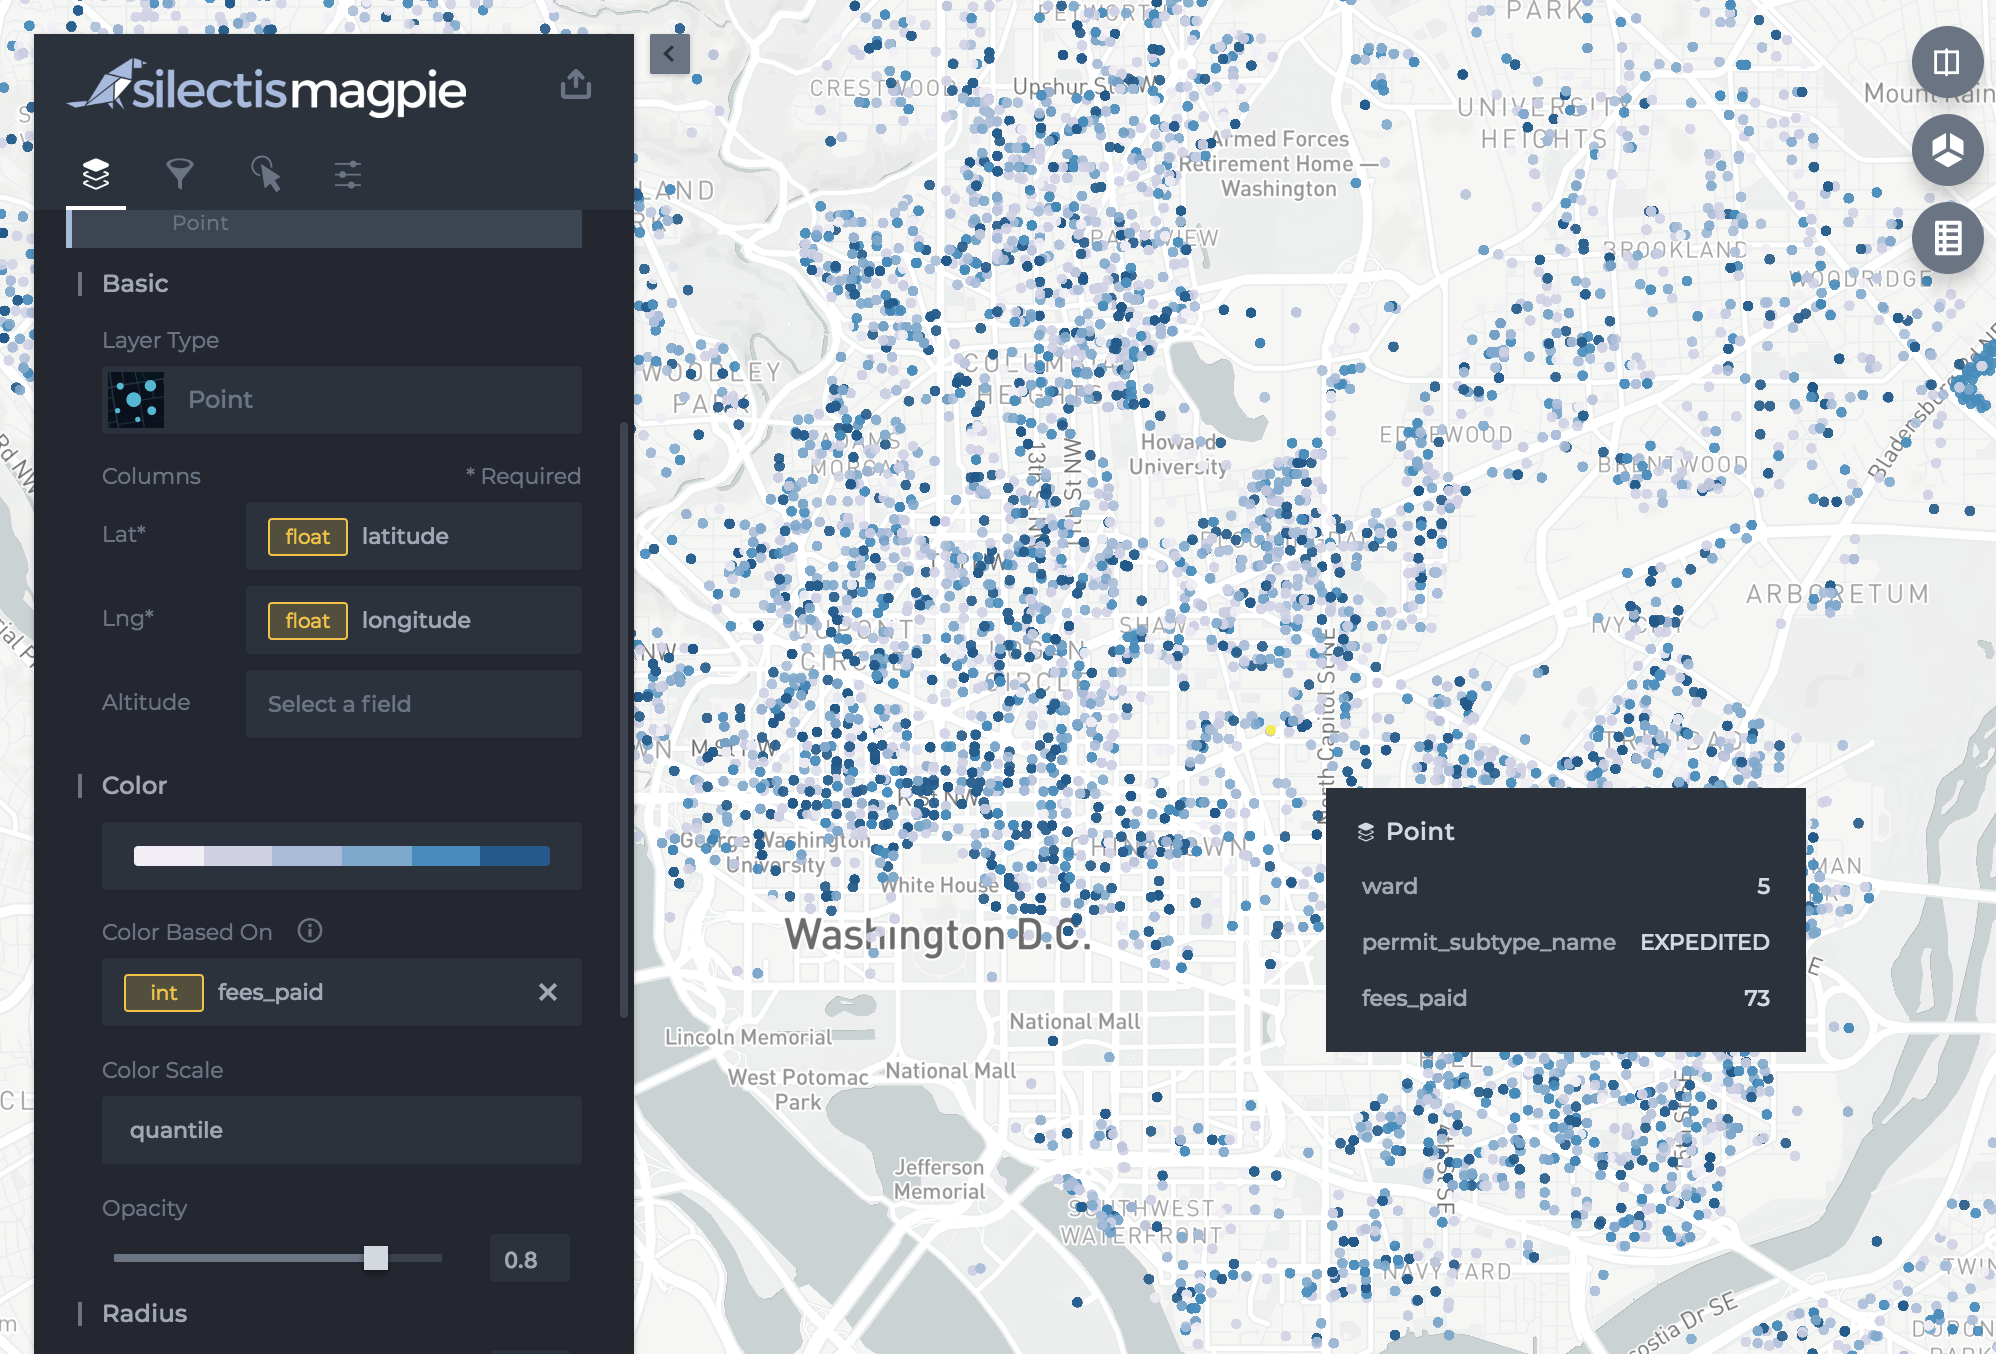
This view can then be customized to visualize the data in different ways using the controls on the left hand side of the screen.